THE OCTOBER SOLAR STORM
Clifford E Carnicom
Oct 25 2003
There appears to be a correspondence between the magnitude of magnetic disturbance that results from an extreme solar storm and the magnitude of apparently artificial ELF-VLF pulse data that has been previously recorded by this researcher. This indicates that any artificially generated pulsed data that has been recorded by this same magnetometer, as is shown below, may also be acting on a global level. The role of the aerosols and the HAARP facility and the propagation of ELF-VLF energy, as is referenced in Magnetics, Aerosols & VLF should also be a consideration in the comparison which is made below.
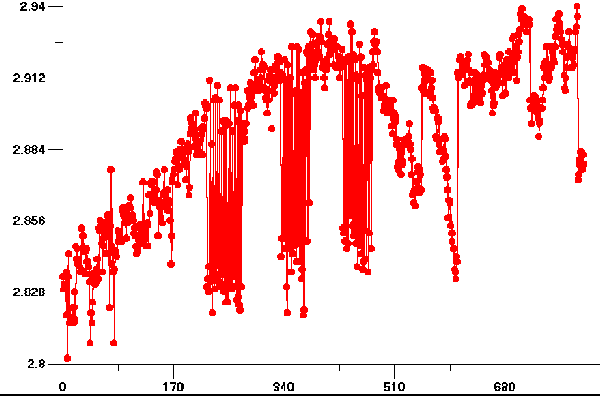
The first graph below shows the extreme variation that occurred in the local magnetometer data collected at this site on October 24 2003 during one of the most momentous solar storms of recorded history. The energy that is shown in this graph was produced by an X class solar flare which had the potential to seriously affect military and communication systems around the globe. Observations were collected at one minute intervals, and the greatest activity is evident over an interval of approximately 6 hours.

Magnetometer Plot of Solar Storm of Oct 24 2003
Y Axis is Voltage
X Axis is Observation Number (1 observation per minute)
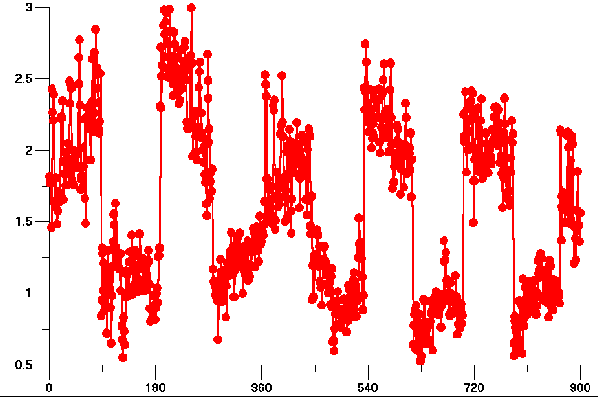
The reader should also observe the extreme anomalous magnetometer data also recorded below on April 05, 2003. The description of this data and the association with observed aerosol banks is provided on the page entitled Magnetics, Aerosols & VLF. It will be noticed that the magnitude of the pulsed and apparently artificial data shown below is on the same order as that which results from the extreme solar storm recorded above. The reader may also wish to review the HAARP Executive Summary referenced on this same page which makes note of the use of pulsed ELF-VLF propagation within that facility.

Magnetometer Pulse Data Logged 040503 at approx. 0845-2210
X Axis : Observation No. (1 per minute)
Y Axis : Volts
The graph below clearly shows what appears to be artificially pulsed data recorded in the Very Low Frequency (VLF) range on this same date of April 05, 2003.

VLF Pulse Data Logged 040503 at approx. 1207-1225
X Axis : Observation No. (1 per second)
Y Axis : Frequency in KHz.
