ELECTROMAGNETIC SIGNATURE
OF THE
AEROSOL OPERATIONS
Clifford E Carnicom
Oct 31 2002
To Be Continued

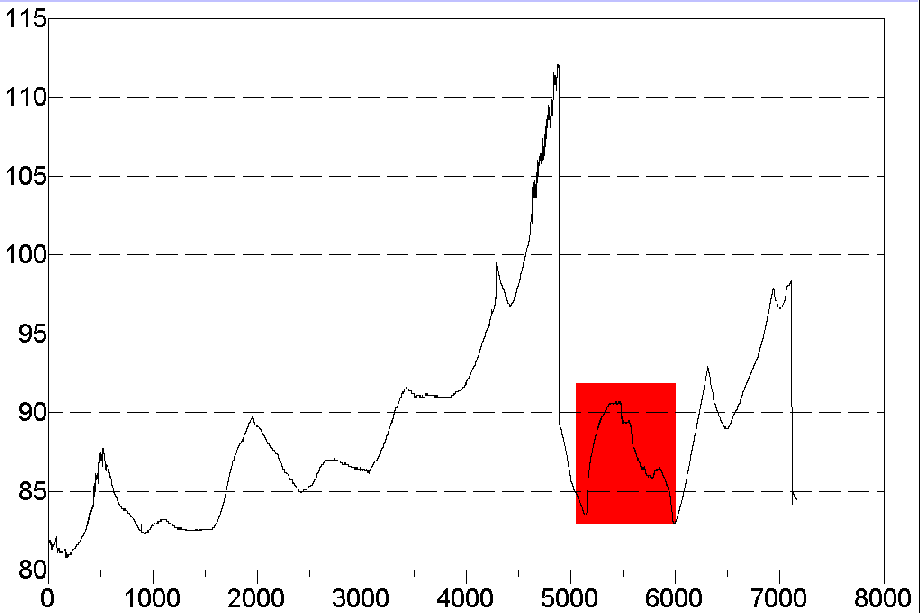
Period Ending 102602 at 2252
X axis : Minutes
Y Axis : Frequency in KHz

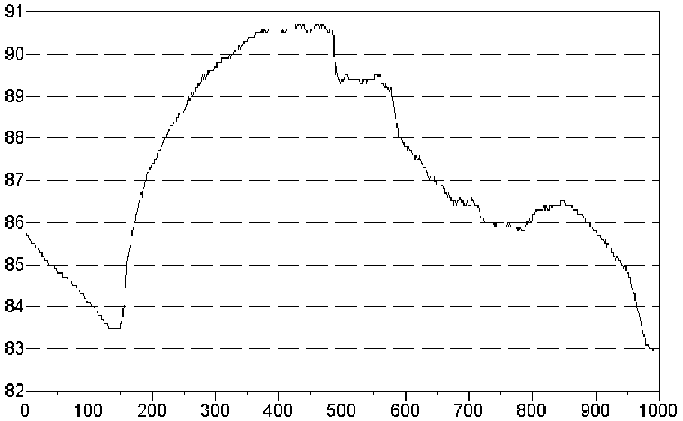
Period ending 102602 at 1524. Corresponds to section outlined in red on graph immediately above.
X axis : Minutes
Y Axis : Frequency in KHz
Note concave structure of increasing frequency in correspondence with onset of local aerosol operations.

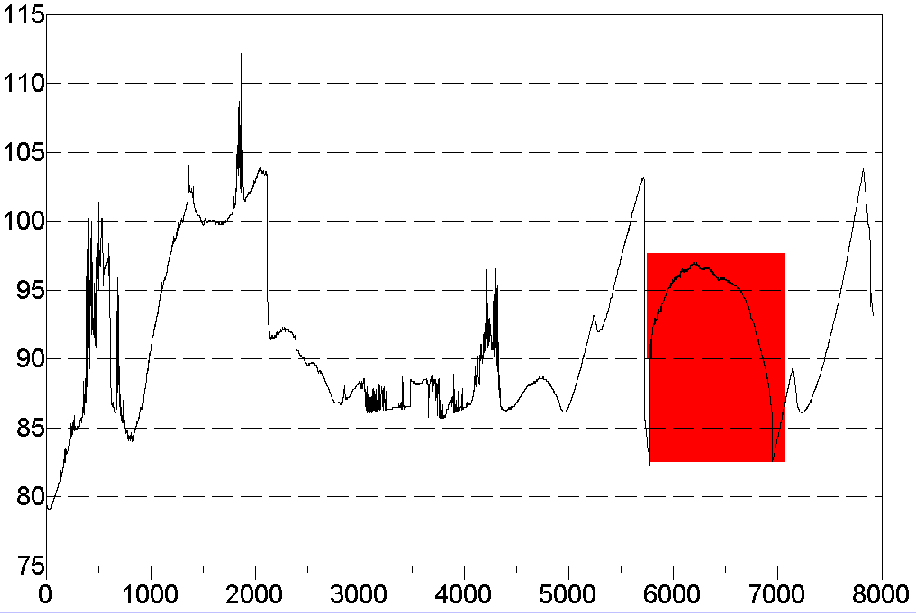
Period Ending 110102 at 2102
X axis : Minutes
Y Axis : Frequency in KHz

Period ending 110102 at 0722. Corresponds to section outlined in red on graph immediately above.
X axis : Minutes
Y Axis : Frequency in KHz
Note concave structure of increasing frequency in correspondence with onset of local aerosol operations.
Note : vertical discontinuities depict meter re-calibration.
To Be Continued
