POTASSIUM INTERFERENCE IS EXPECTED

POTASSIUM INTERFERENCE IS EXPECTED

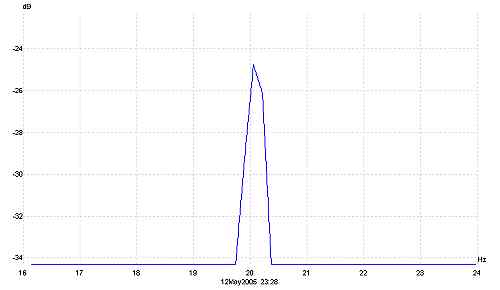
It is shown within this report that the potassium ion is specifically expected to incur biological interference within people over large regions of the earth's surface. This is due to the fact that the fifth harmonic of the ELF that has been repeatedly measured over a period of several years corresponds to the cyclotronic resonant frequency of potassium. This fifth harmonic, along with numerous other harmonics is a regular component of the ELF radiation that under measurement at this time. This expected interference, albeit intentional or not, can be shown to exist based upon the principles and physics of cyclotronic resonance, a phenomenon well established in classical electromagnetic theory. The emphasis in this report is upon the potassium ion, which is of fundamental importance to human health. Although there are additional ions which deserve discussion at a later point, the primary ranking of potassium in human biology is of special concern. Additional discussion on this page outlines the definition of cyclotronic resonance, as well as a mathematical model for determining the atomic number for an element (in this case potassium) that is affected by a particular cyclotronic frequency. And though such unique combinations, such as in this case with potassium, are not common, they do occur. They are of concern with respect to human biological function and interference, as these ions will absorb energy and can lead to the disruption of cellular ion exchange processes.
CONDUCTIVITY: The Air, The Water, and The Land

CONDUCTIVITY: The Air, The Water, and The Land

Clifford Carnicom discusses a series of conductivity tests conducted on recent heavy snowfall samples collected in New Mexico and Arizona in 2005, which have refocused attention on the electrolytic, ionic and conductive properties of environmental samples in connection with the aerosol operations. This report has been received and documents unusually high levels of calcium and potassium within a rain sample, where previous work has demonstrated unexpected levels of barium and magnesium. Discussion in this work ensues and outlines conductivity testing on these samples, where conductivity is a means to measure the ionic concentration within a solution. Conductivity is proportional to ionic concentration, and the results of this testing shows the increased conductivity of the atmosphere from having these salts dispersed in the aerosol operations. This discussion also describes the difficulty of performing conductivity testing because of the concept of 'ohmic heating', extrapolates the testing results to calculate the volume of these ionic salts within the regional atmosphere, and considerations to what the implications are of having these elements in our air, land and water.
THE WAISTLINE OF ROTATION

THE WAISTLINE OF ROTATION

The postulate that a decrease in the earth’s rotational speed will result in an increase of the equatorial radius of the earth from this change is demonstrated here using two different mathematical analyses. Clifford Carnicom shows that a slowdown of just one second a year in the earth’s rotation would result in an increase of 4-8 inches in the radius of the earth. First, Carnicom examines the kinetic energy and inertial momentum of the earth as it relates to differentials (this results in the 4 inch radius calculation stated above), and the second method examines this same issue from the viewpoint of angular momentum (results in the 8 inch increase of the earth’s radius above). Greater changes in the rotational rate (current observations support a change of 12 seconds per year) result in correspondingly greater changes in the equatorial radius of the earth. Refer to the following Carnicom papers previously released addressing earlier considerations of this subject: ’TIME’ (dated July 24, 2003), ’TIME TO START WATCHING TIME’ (dated August 14, 2003), and ’TIME, ENERGY and EARTH CHANGES’ (dated August 26, 2003).
ESTIMATED LOWER ATMOSPHERIC ELECTROMAGNETIC PROPERTIES

ESTIMATED LOWER ATMOSPHERIC ELECTROMAGNETIC PROPERTIES

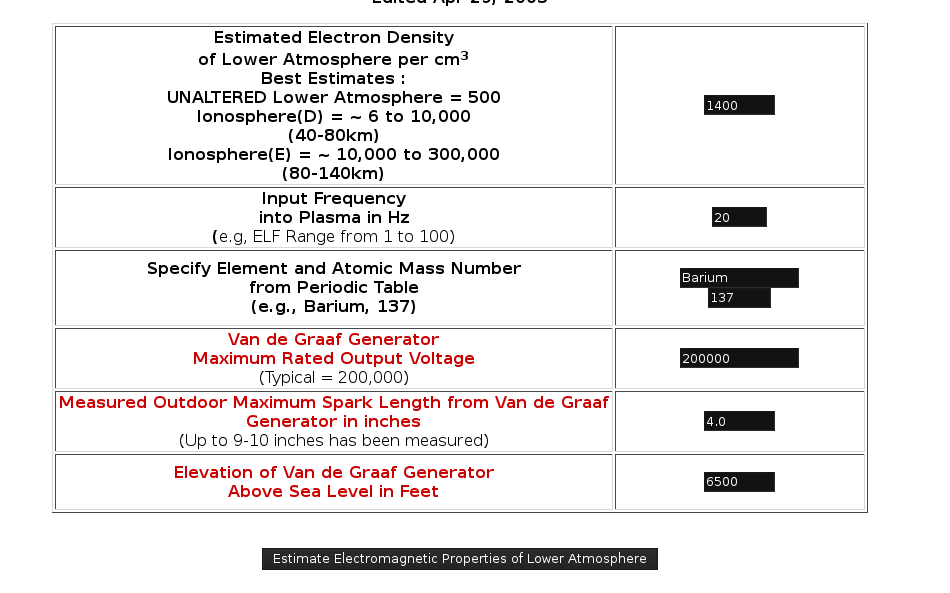
A web based calculator for estimating lower atmospheric magnetic properties is included on this page. By plugging values of electron density, ELF range, element and atomic mass number, and Van de Graaf spark length, this calculator estimates electromagnetic properties of the lower atmosphere, including predicted Whistler frequency, Alfven wave frequency, plasma frequency, lower atmospheric conductivity and more. Mathematical calculations for manually calculating these same values are included in a discussion also on this page.
ATMOSPHERIC CONDUCTIVITY II

ATMOSPHERIC CONDUCTIVITY II

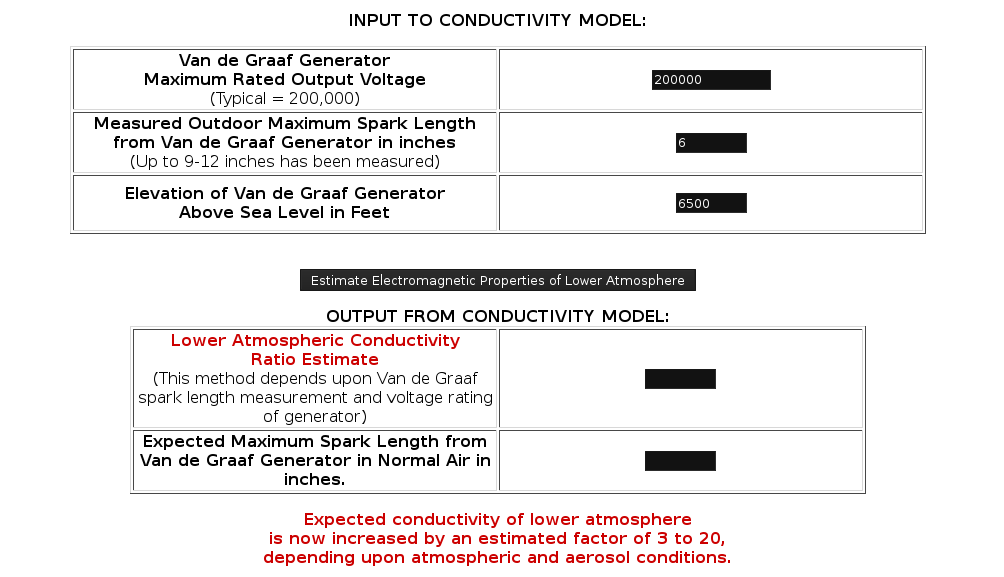
Citing earlier concerns about and research into the topic of changing conductivity of the atmosphere from aerosol chemicals (see the previous Carnicom paper titled ATMOSPHERIC CONDUCTIVITY dated July 9, 2001 for more information on this topic), Carnicom discusses a method to estimate the atmospheric conductivity using a Van de Graaf generator. This generator uses a rated voltage capacity to cause sparks using the conductivity of the air as the medium. The longer the spark that can be achieved when the generator is activated, the more conductive the atmosphere is. Results presented in this work indicate an increase in the conductivity of the lower atmosphere by a factor of approximately 3 to 20 from a baseline ‘normal’ known value of air. The benefit of the current study is that it provides an estimate as to the magnitude of the change in atmospheric conductivity using relatively simple methods and equipment. Provided on this paper is a calculator that can be used to predict the ratio of increase in conductivity relative to the expected value of a normal atmosphere, as is a detailed mathematical analysis showing the calculations used to determine how to measure conductivity of the atmosphere and the use of electron density for this determination .
A QUESTION OF ALFVEN?

A QUESTION OF ALFVEN?

A signal in the range of roughly 75-100KHz has been shown to be continuously present as measured by the ELF-LF (Extremely Low Frequency-Low Frequency) detection circuit, discussed in the previous Carnicom paper titled LF FREQUENCY MONITORING BEGINS (from November 5, 2002). This paper presents two theories as to the reason for this signal being ever present in the circuit. The first is the possibility of their being a resonant frequency being introduced into the circuit as a result of the op amp being used. The circuit itself is generating the reference signal, which can then be evaluated with respect to variations in frequency caused by external electromagnetic influences. Though this seems like a plausible explanation, Carnicom makes note of the fact that this ‘reference’ frequency varies over time, which raises further questions. The second explanation for the ‘reference’ frequency being seen in this circuit has to do with the existence of Alfven waves, and their relation to earlier historical discovery of the propagation of what are called Whistler waves. The presence of ELF waves in conjunction with the aerosol operations as a topic of research is discussed, as there are serious implications with respect to human health and mental functioning if such a propagation is ever verified.
THE PLASMA FREQUENCY: RADAR APPLICATIONS

THE PLASMA FREQUENCY: RADAR APPLICATIONS

This work details an analysis made that indicates that one of the primary applications of the aerosol operations is likely to involve the advanced use of radar technology for military purposes. Discussion ensues of the definition of plasma, with plasma being an ionized gas consisting of ions and free electrons distributed over a region in space. The effect of aerosol operations can lead to no other logical conclusion except that the lower atmosphere itself has been altered to a plasma state. The importance of the concept of ‘plasma frequency’ is outlined in a quote from Richard Feynman: “This natural resonance of a plasma has come interesting effects. For example, if one tries to propagate a radio wave through the ionosphere, one finds that it can penetrate only if its frequency is higher than the plasma frequency. Otherwise the signal is reflected back. We must use high frequencies if we wish to communicate with a satellite in space. On the other hand, if we wish to communicate with a radio station beyond the horizon, we must use frequencies lower than the plasma frequency, so that the signal will be reflected back to earth.” A detailed discussion of the calculations of the plasma frequency for the ionosphere ensues in this work that supports the notion that a significant application of the aerosol operations may well involve the propagation of radio waves over extended distances. There are numerous military and electromagnetic propagation applications that become evident from this finding.
AIR QUALITY DATA REQUIRES PUBLIC SCRUTINY

AIR QUALITY DATA REQUIRES PUBLIC SCRUTINY

A case is made here for the need to have independent testing and verification performed of current atmospheric particulate counts in the United States. The basis for such a need includes; the repeated observations of the decline in visibility in the US (which is directly related to particulate concentrations), the unwillingness of the US Environmental Protection Agency (EPA) to adequately address concerns of countless citizens regarding atmospheric degradation by aircraft aerosol operations; the US National Weather Service’s reduction of visibility reporting standards from a maximum of 40 miles to a maximum of 10 miles; the apparent limitations of access to post-1998 public data base files that involves direct atmospheric monitoring by government bodies such as NOAA’s Climate Monitoring and Diagnostics Laboratory; and the newly released 1999 US mortality statistics showing an increase in chronic lower respiratory deaths. A theory of light scattering is discussed to be used as an initial estimator of atmospheric concentrations of particulate data, with example cases used to illustrate how such models can be used to estimate these
CONTRAIL FORMATION MODEL

CONTRAIL FORMATION MODEL

A preliminary model is presented here to be used to predict whether contrails will form or not under reported meteorological conditions at flight altitude. Contrail prediction models are difficult to attain, so this model is presented for investigative purposes only. This model can and will be evaluated with actual observations in an effort to test it for reliability.
CONTRAIL DISTANCE FORMATION MODEL

CONTRAIL DISTANCE FORMATION MODEL

This paper outlines a model developed that estimates the distance behind the engines that a contrail (condensed trail of water vapor) is expected to form. The model results support exceptionally well a statement issued by the United States Air Force (USAF) that ‘contrails become visible roughly about a wingspan distance behind the aircraft’. An abundance of photographic and video evidence shows the repeated formation of aerosol trails in much closer proximity to the engines than that established by the USAF. The evaluation presented in this work adds to the multitude of studies that conclusively demonstrate that the emissions from aerosol operations are not composed primarily of water vapor. A very detailed model calculation is presented supporting these claims.
CONTRAIL PHYSICS

CONTRAIL PHYSICS

This paper discusses a preliminary model developed in order to estimate the length of time required for ‘normal’ contrails to dissipate. The model developed agrees extremely well with historical behavior and observation of contrails. Conclusions that result from the study of this model include the expected rate of water vapor based contrails, and that the rates of dissipation for normal contrails are based on the size of ice crystal particulates and amount of solar radiation. A further conclusion drawn is that if an observed contrail does not conform to the model, it is likely that the material of emission is not water vapor.